
Product: Talis Advanced MIS add-on module
This case study explores how La Trobe University leveraged Talis Aspire Advanced MIS to integrate Talis Aspire data with additional data sources, generating dynamic reports and dashboards through Power BI. This integration provided crucial insight into student engagement with digital resources, informed procurement decisions and streamline the library’s overall workflow.
The Challenge
La Trobe University library, committed to a digital-first policy, faced several challenges in optimizing its library operations. The library sought an automated solution to track the digitization of resources and monitor student engagement with both digital and print materials. A particular challenge arose from the decision to use a single time period in Talis Aspire, which complicated the reporting process. The library also needed a way to integrate Talis Aspire data with their curriculum management system, CourseLoop, to effectively monitor active and discontinued courses and get much deeper insight into course engagement and usage.
The Solution
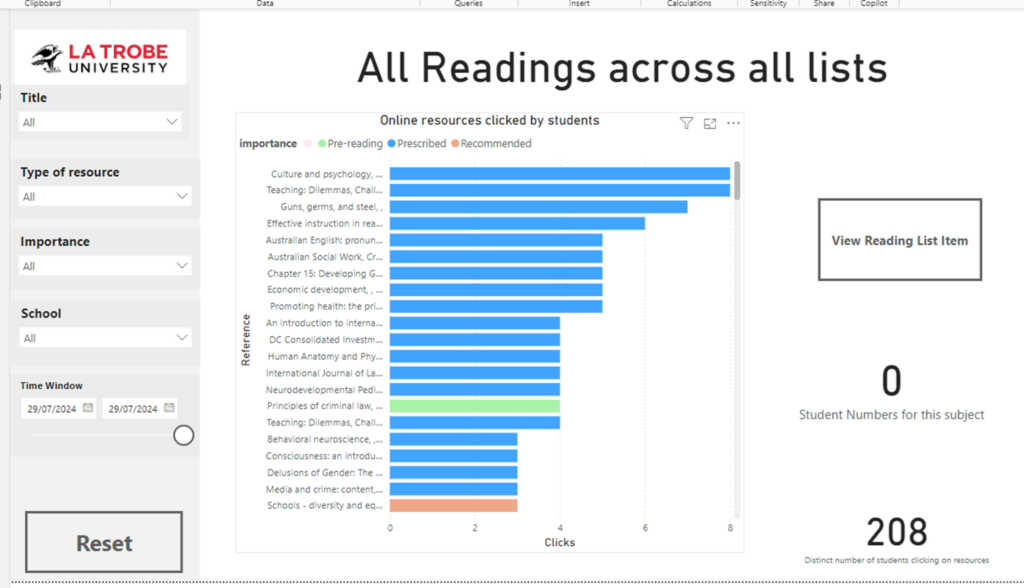
By integrating Talis Advanced MIS, La Trobe University transformed its reporting capabilities. The integration of Talis Aspire data with CourseLoop allowed the library to display and analyze this data using Power BI. This integration enabled the creation of reports that tracked student engagement with prescribed resources and provided insights into the types of resources accessed from reading lists. Moreover, the integration streamlined the mapping of different subjects to multiple time periods, optimizing the library’s general workflow and addressing the initial complications posed by the single time period in Talis Aspire.
The Result
The newly developed reports and dashboards have significantly improved the conversations between Liaison Librarians and faculty members. The library can now easily identify reading lists containing print items and encourage faculty to switch to digital resources where possible or consider Open Educational Resources (OERs), contributing to cost savings for the university. This approach has also enhanced the library’s resource procurement process, allowing for the identification of items that cannot yet be converted to digital formats using “library notes”, facilitating ongoing reviews of these items to check for the availability of digital versions later.
Additionally, the implementation of these reports and dashboards has enabled the library to enforce a policy that ensures every subject listed in CourseLoop has an associated reading list. This effort has resulted in 75% of courses now having a reading list. The library has also successfully tracked the percentage of lists containing ‘all-digital’ prescribed items, currently at 85%.
An unexpected benefit of these reports has been their utility as analytics tools, allowing the library to maintain better oversight of its operations. For example, when a new subject is created in CourseLoop, the team can quickly determine if a corresponding reading list exists. Similarly, the reports help monitor the discontinuation of subjects, ensuring that unnecessary reading lists are retired. The reports also highlight lists awaiting review, keeping the library’s workflow on track.
Another unforeseen outcome has been the ability to track reading lists with low student engagement. In some cases, this analysis has revealed that some lists were not integrated within the university’s Learning Management System (Moodle) and suffered from reduced visibility, leading to fewer student views. This insight has prompted efforts to improve the accessibility and promotion of reading lists.
Learning Points
A key learning point from this initiative has been the value of having team members who are not only familiar with reading lists but also possess expertise in data visualization software like Power BI. These individuals bring essential knowledge of reading list structures, time periods, and list rollovers, which is crucial when building effective dashboards and reports.
For institutions looking to implement data visualization tools like Power BI, the advice is to start by analyzing data from a single report. Power BI’s ability to import and test data from spreadsheets makes it an ideal platform for experimentation and hands-on learning.
Another key recommendation is to integrate AI into the library’s workflow. AI has proven invaluable for helping to master new systems and writing code, further streamlining operations.
Next Steps
Looking ahead, La Trobe University library plans to continue refining its reporting capabilities by incorporating Open Access data from OpenAlex into its reports. This will provide a clearer picture of the proportion of open-access resources in reading lists.
The university has also recently introduced a student dashboard, which tracks student interactions with resources.
In the long term, this dashboard will help identify high-usage items that may require additional copies and low-usage items that could be removed from reading lists. These developments will further enhance the library’s ability to manage resources efficiently and support student success.
We extend our sincere gratitude to Jamie McDonald from La Trobe University for his invaluable contributions and insights, which were instrumental in the creation of this case study. For any inquiries regarding the reports discussed within the case study, please contact Jamie McDonald at La Trobe University via email: j.mcdonald2@latrobe.edu.au.
Interested?
If you’d like to learn more about Talis Advanced MIS, contact us.